Sunday, April 14, 2024

Geosimulations for Addressing Societal Challenges @ AAG 2024

At the upcoming American Association of Geographers (AAG) Annual Meeting in Honolulu, Hawaii, we (Alison Heppenstall, Na (Richard) Jiang, Gary Polhill, Andrew Crooks, Raja Sengupta, Suzana Dragicevic, Sarah Wise, Jeon-Young Kang) have organized 3 sessions around the theme of Geosimulations for Addressing Societal Challenges. This is part of the 10th Anniversary Symposium on Human Dynamics Research. If you are at the AAG on Tuesday the 16th of April and have the time it would be great if you could stop by and see the talks. Details are below.

Sessions Abstract: 

There is an urgent need for research that promotes sustainability in an era of societal challenges ranging from climate change, population growth, aging and wellbeing to that of pandemics. These need to be directly fed into policy. We, as a Geosimulation community, have the skills and knowledge to use the latest theory, models and evidence to make a positive and disruptive impact. These include agent-based modeling, microsimulation and increasingly, machine learning methods. However, there are several key questions that we need to address which we seek to cover in this session. For example, What do we need to be able to contribute to policy in a more direct and timely manner? What new or existing research approaches are needed? How can we make sure they are robust enough to be used in decision making? How can geosimulation be used to link across citizens, policy and practice and respond to these societal challenges? What are the cross-scale local trade-offs that will have to be negotiated as we re-configure and transform our urban and rural environments? How can spatial data (and analysis) be used to support the co-production of truly sustainable solutions, achieve social buy-in and social acceptance? And thereby co-produce solutions with citizens and policy makers.

Session 1 (Date: 4/16/2024; Time: 10:40 AM - 12:00 PM; Room: 312 (Ni`ihua), Third Floor, Hawai'i Convention Center)

Chair: Na (Richard) Jiang

Presentions:


Session 2 (Date: 4/16/2024; Time: 1:20 PM - 2:40 PM;  Room: 312 (Ni`ihua), Third Floor, Hawai'i Convention Center)

Chair: Suzana Dragicevic

Presentions:

Thursday, April 11, 2024

Addressing equifinality in agent-based modeling

In the past we have blogged about the challenges of agent-based modeling but one thing we have not written much about is the challenge of uncertainty especailly when it comes to model calibration. This uncertainty is a challenge when it when it comes to situations where various parameter sets fit observed data equally well. This is known as equifinality which is a principle or phenomenon in system theory that implies that different paths can lead to the same final state or outcome. 

In a new paper with paper with Moongi Choi, Neng Wan, Simon Brewer, Thomas Cova and Alexander Hohl entitled "Addressing Equifinality in Agent-based Modeling: A Sequential Parameter Space Search Method Based on Sensitivity Analysis" we explore this issue. More specifically we introduce an Sequential Parameter Space Search (SPS) algorithm to confront the equifinality challenge in calibrating fine-scale agent-based simulations with coarse-scale observed geospatial data, ensuring accurate model selection using a pedestrian movement simulation as a test case.  

If this sounds of interest and you want to find out more, below you can read the abstract to the paper, see the logic of our simulation and some of the results. At the bottom of the page, you can find a link to the paper along with its full reference. Furthermore, Moongi has made the data and codes for indoor pedestrian movement simulation and Sequential Parameter Space search algorithm openly available at https://zenodo.org/doi/10.5281/zenodo.10815211 and https://zenodo.org/doi/10.5281/zenodo.10815195.

Abstract 

This study addresses the challenge of equifinality in agent-based modeling (ABM) by introducing a novel sequential calibration approach. Equifinality arises when multiple models equally fit observed data, risking the selection of an inaccurate model. In the context of ABM, such a situation might arise due to limitations in data, such as aggregating observations into coarse spatial units. It can lead to situations where successfully calibrated model parameters may still result in reliability issues due to uncertainties in accurately calibrating the inner mechanisms. To tackle this, we propose a method that sequentially calibrates model parameters using diverse outcomes from multiple datasets. The method aims to identify optimal parameter combinations while mitigating computational intensity. We validate our approach through indoor pedestrian movement simulation, utilizing three distinct outcomes: (1) the count of grid cells crossed by individuals, (2) the number of people in each grid cell over time (fine grid) and (3) the number of people in each grid cell over time (coarse grid). As a result, the optimal calibrated parameter combinations were selected based on high test accuracy to avoid overfitting. This method addresses equifinality while reducing computational intensity of parameter calibration for spatially explicit models, as well as ABM in general. 

Keywords: Agent-based modeling equifinality calibration sequential calibration approach sensitivity analysis.

Detail model structures and process of the simulation.
Pedestrian simulation ((a) Position by ID, Grouped proportion – (b) 0.1, (c) 0.5, (d) 0.9).
Multiple sub-observed data ((a) # grid cells passed by each individual, (b) # individuals in 1x1 grid, (c) # individuals in 2x2 grid cells).

Validation results with train and test dataset ((a) Round 1, (b) Round 2, (c) Round 3).

Full Reference: 

Choi, M., Crooks, A.T., Wan, N., Brewer, S., Cova, T.J. and Hohl, A. (2024), Addressing Equifinality in Agent-based Modeling: A Sequential Parameter Space Search Method Based on Sensitivity Analysis, International Journal of Geographical Information Science. https://doi.org/10.1080/13658816.2024.2331536. (pdf)

Wednesday, March 27, 2024

Community resilience to wildfires: A network analysis approach by utilizing human mobility data

Quantifying community resilience especially after a disaster is an open research challenge. However, with the growth in mobility datasets such as SafeGraph we are being given new opportunities to study how communities rebound from disaster.  

To this end, in a new paper with Qingqing Chen and Boyu Wang entitled "Community resilience to wildfires: A network analysis approach by utilizing human mobility data" which was published in Computers, Environment and Urban Systems we develop a framework to quantify resilience after a disaster using network analysis. To showcase this framework we us a human mobility data associated with two wildfires (Mendocino Complex and Camp wildfires) in California and measure the robustness and vulnerability of different communities over time. 

Our results show community resilience is closely tied to socio-economic and built environmental traits of the affected areas and as such our approach paves a way to study disasters and their long-term impacts on society. If this sounds of interest, below you can read the abstract to the paper, see some of the figures we use to explain and demonstrate our approach, while at the end of the post you can find the full reference along with a link to the paper. 

Abstract:
Disasters have been a long-standing concern to societies at large. With growing attention being paid to resilient communities, such concern has been brought to the forefront of resilience studies. However, there is a wide variety of definitions with respect to resilience, and a precise definition has yet to emerge. Moreover, much work to date has often focused only on the immediate response to an event, thus investigating the resilience of an area over a prolonged period of time has remained largely unexplored. To overcome these issues, we propose a novel framework utilizing network analysis and concepts from disaster science (e.g., the resilience triangle) to quantify the long-term impacts of wildfires. Taking the Mendocino Complex and Camp wildfires - the largest and most deadly wildfires in California to date, respectively - as case studies, we capture the robustness and vulnerability of communities based on human mobility data from 2018 to 2019. The results show that demographic and socioeconomic characteristics alone only partially capture community resilience, however, by leveraging human mobility data and network analysis techniques, we can enhance our understanding of resilience over space and time, providing a new lens to study disasters and their long-term impacts on society.

Keywords: Wildfire, Community resilience, Network analysis, Resilience triangle, Human mobility data.   

Resilience triangle. (a) The original resilience triangle (adapted from Bruneau et al., 2003); (b) The modified resilience triangle used in this study.

An overview of the research outline.
The zoomed in study areas of the two wildfires, where the blue areas highlight the Census Block Groups; (b) The spatial distribution of wildfire density from 2005 to 2022; (c) The distribution of annual wildfires and acres in the U.S.
The distribution of degree centrality for each census block group colored by different clusters. (a) The Camp wildfire; (b) The Mendocino Complex wildfire.
The results of resilience triangles of clustered CBGs and resilience features. (a) The determined resilience triangles of clustered CBGs for Camp wildfire; (b) The determined resilience triangles of clustered CBGs for Mendocino Complex wildfire; (c) Vulnerability of CBGs within the two wildfire areas; (d) Robustness of CBGs within the two wildfires.

Full Reference: 
Chen, Q., Wang, B. and Crooks, A.T. (2024), Community Resilience to Wildfires: A Network Analysis Approach by Utilizing Human Mobility Data, Computers, Environment and Urban System, 110: 102110. (pdf)

Monday, February 19, 2024

Exploring the New Frontier of Information Extraction through Large Language Models in Urban Analytics

Over the last year or so there has been a lot of hype about artificial intelligence (AI) and Large Language Models (LLMs) in particular, such as Generative Pre-trained Transformers (GPT) like ChatGPT. In a recent editorial in Environment and Planning B written by Qingqing Chen and myself we discussed how LLMs could be used for lower the barrier for researchers wishing to study urban problems through the lens of urban analytics. For example, analyzing street view images in the past required training and segmentation of such data which a time consuming and a rather technical task. But what can be done using ChatGPT? To test this we provided ChatGPT some images from Flickr and Mapillary: 

Examples of using ChatGPT for extracting information from imagery.

And then asked it some questions and we were quite amazed by the answers:  

Examples questions and responses when using ChatGPT for extracting information from imagery.

If this sounds of interest I encourage you to read the editorial and think how you could leverage LLMs for your own research. 

Full Reference: 

Crooks A.T. and Chen, Q (2024), Exploring the New Frontier of Information Extraction through Large Language Models in Urban Analytics, Environment and Planning B. Available at https://doi.org/10.1177/23998083241235495. (pdf)

Tuesday, December 19, 2023

Crowdsourcing Dust Storms in the United States Utilizing Flickr

In the past on this site we have written about how one can use social media to study the world around us. Often the focus has been on Twitter but that is not the only social media platform available.  Another is Flickr, and while in past posts have show how we can use this platform to explore bird sightings, wildfires and human migration we are now turning our attention to other phenomena. One of which is dust storms. Working with Festus Adegbola and Stuart  Evans we have just presented a poster at the 2023 American Geophysical Union Fall Meeting entitled "Crowdsourcing Dust Storms in the United States Utilizing Flickr"

In this research we compare Flickr images with National Weather Service  advisories and the VIIRS Deep Blue aerosol product data from the Suomi-NPP satellite. Our preliminary findings show that Flickr images of dust storms have a substantial co-occurrence with regions of NWS blowing dust advisories. If this sounds of interest, below you can read our abstract, see our workflow and the poster itself. 

Abstract

Dust storms are natural phenomena characterized by strong winds carrying large amounts of fine particles which have significant environmental and human impacts. Previous studies have limitations due to available data, especially regarding short-lived, intense dust storms that are not captured by observing stations and satellite instruments. In recent years, the advent of social media platforms has provided a unique opportunity to access a vast amount of user-generated data. This research explores the utilization of Flickr data to study dust storm occurrences within the United States and their correlation with National Weather Service (NWS) advisories. The work ascertains the reliability of using crowdsourced data as a supplementary tool for dust storm monitoring. Our analysis of Flickr metadata indicates that the Southwest is most susceptible to dust storm events, with Arizona leading in the highest number of occurrences. On the other hand, the Great Plains show a scarcity of Flickr data related to dust storms, which can be attributed to the sparsely populated nature of the region. Furthermore, seasonal analysis reveals that dust storm events are prevalent during the Summer months, specifically from June to August, followed by Spring. These results are consistent with previous studies of dust occurrence in the US, and Flickr-identified images of dust storms show substantial co-occurrence with regions of NWS blowing dust advisories. This research highlights the potential of unconventional user-generated data sources to crowdsource environmental monitoring and research.

Data collection and workflow.
Distribution of Flickr identified dust storm occurrences and NWS dust storm advisories.

Full Reference: 

Adegbola, F., Crooks, A.T. and Evans, S. (2023), Crowdsourcing Dust Storms in the United States Utilizing Flickr, American Geophysical Union (AGU) Fall Meeting, 11th – 15th December, San Francisco, CA. (abstract, poster)

Tuesday, November 14, 2023

Massive Trajectory Data Based on Patterns of Life

Following on from the last post, we (Hossein AmiriShiyang RuanJoon-Seok KimHyunjee JinHamdi KavakDieter PfoserCarola Wenk and Andreas Zufle and myself) have a paper in the Data and Resources track at the 2023 ACM SIGSPATIAL International Conference on Advances in Geographic Information Systems entitled "Massive Trajectory Data Based on Patterns of Life".  

This Data and Resources paper introduces readers to a large sets of simulated individual-level trajectory and location-based social network data we have generated from our Urban Life Model (click here to find out more about the model). The data comprises of 4 suburban and urban regions, including 1) the George Mason University Campus area, Fairfax, Virginia, 2) the French Quarter of New Orleans, Louisiana, 3) San Francisco, California, and 4) Atlanta, Georgia. For each of the 4 study regions, we run the simulation with 1K, 3K, 5K, and 10K agents for 15 months of simulation time. We also provide simulations for 10 years and 20 years, having 1K agents for each of the 4 regions of interest. For each dataset, three items are provided: 1) Check-ins, and 2) social network links and 3) trajectory information per agent per five-minute tick. As such we argue in the paper that our datasets are orders of magnitude larger than existing real-world trajectory and location-based social network (LBSN) data sets. 

If this sounds of interest we encourage readers to check out the paper (see the bottom of this post), while the datasets, as well as additional documentation, can be found at OSF (https://osf.io/gbhm8/) and the data generator (model) can be found at https://github.com/azufle/pol.

Abstract: Individual human location trajectory and check-in data have been the driving force for human mobility research in recent years. However, existing human mobility datasets are very limited in size and representativeness. For example, one of the largest and most commonly used datasets of individual human location trajectories, GeoLife, captures fewer than two hundred individuals. To help fill this gap, this Data and Resources paper leverages an existing data generator based on fine-grained simulation of individual human patterns of life to produce large-scale trajectory, check-in, and social network data. In this simulation, individual human agents commute between their home and work locations, visit restaurants to eat, and visit recreational sites to meet friends. We provide large datasets of months of simulated trajectories for two example regions in the United States: San Francisco and New Orleans. In addition to making the datasets available, we also provide instructions on how the simulation can be used to re-generate data, thus allowing researchers to generate the data locally without downloading prohibitively large files.

Full Referece: 

Amiri, H., Ruan, S., Kim, J., Jin, H., Kavak, H., Crooks, A.T., Pfoser, D., Wenk, C. and Züfle, A. (2023), Massive Trajectory Data Generation using a Patterns of Life Simulation, Proceedings of the 2023 ACM SIGSPATIAL International Conference on Advances in Geographic Information Systems, Hamburg, Germany. (pdf)

Monday, November 13, 2023

Synthetic Geosocial Network Generation

In the past the blog has explored the creation of social networks for models. Keeping with this vain of research, I was fortunate to work with Ketevan GallagherTaylor Anderson and Andreas Züfle to consider the role of location of individuals when generating social networks. This work has resulted in a new paper entitled "Synthetic Geosocial Network Data Generation"  which was presented at the 7th ACM SIGSPATIAL Workshop on Location-based Recommendations, Geosocial Networks and Geoadvertising (LocalRec 2023). If this sounds of interest, below you can read the abstract to the paper, see some the generated geosoical networks and find the full reference and link to the paper. In addition to this, the Python code and data used to generate the networks is available at https://github.com/KetevanGallagher/Synthetic-Geosocial-Networks.

Abstract: Generating synthetic social networks is an important task for many problems that study humans, their behavior, and their interactions. Geosocial networks enrich social networks with location information. Commonly used models to generate synthetic social networks include the classical Erdos-Renyi, Barabasi-Albert, and Watts-Strogatz models. However, these classic social network models do not consider the location of individuals. Real-world geosocial networks do exhibit a strong spatial autocorrelation, thus having a higher likelihood of a social connection between agents that are spatially close. As such, recent variants of the three classical models have been proposed to consider location information. Yet, these existing solutions assume that individuals are located on a uniform lattice and exhibit certain limitations when applied to real-world data that exhibits clusters. In this work, we discuss these limitations and propose new approaches to extend the three classic social network generation models to geosocial networks. Our experiments show that our generated synthetic geosocial networks address the shortcomings of the state-of-the-art models and generate realistic geosocial networks that exhibit high similarity to real-world geosocial networks. 
Keywords: Geosocial Networks, Network Generation, Synthetic Social Networks, Erdos-Renyi, Watts-Strogatz, Barabasi-Albert.


Real- World Geosocial Network using Facebook Social Connectedness Data between Zone Improvement Plan (ZIP) Region Centroids for the State of Virginia, USA.
Geosocial graphs using Virginia ZIP code data.
Graphs using Fairfax Census Tract data.


Full Referece:
Gallagher, K., Anderson, T., Crooks, A.T. and Züfle, A. (2023), Synthetic Geosocial Network Data Generation, Proceedings of the 7th ACM SIGSPATIAL Workshop on Location-based Recommendations, Geosocial Networks and Geoadvertising (LocalRec 2023), Hamburg, Germany. (pdf) (presentation)

Friday, November 03, 2023

Geographically Synthetic Populations for ABM: A Gallery of Applications

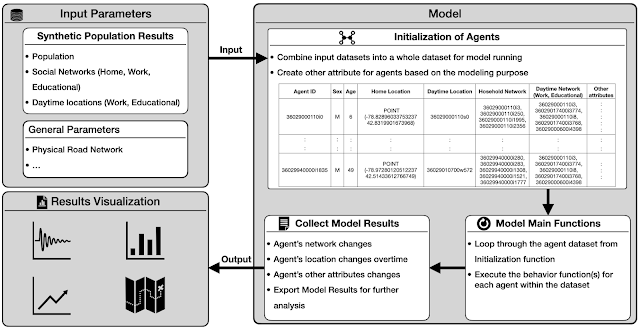
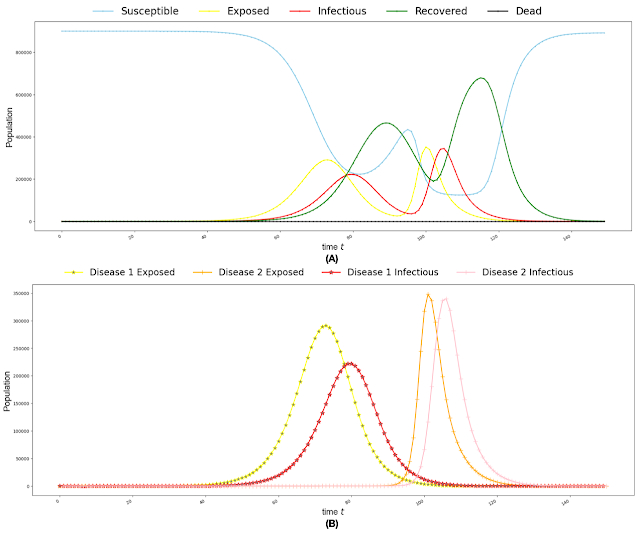
Often we are building geographically explicit agent-based models we spend a lot of time creating the synthetic population to instantiate our artificial world. We have tired to overcome this with creating methods to generate such populations (see this old blog post). Building on this work, Na (Richard) Jiang, Fuzhen Yin, Boyu Wang and myself have a new paper entitled "Geographically-Explicit Synthetic Populations for Agent-based Models: A Gallery of Applications" which was presented at 2023 Computational Social Science Society of the Americas conference. In the paper we extend the synthetic population to the whole of New York state. While at the same time we introduce a pipeline for using the population datasets for model initialization. To show this pipeline, we present several case studies utilizing Python and Mesa. These models range from that of commuting to disease spread and vaccination uptake. If this sounds of interest, below we provide the abstract to the paper along with some of the key figures including our pipeline and example applications. At the bottom of the page we provide the full reference and a link to the paper which has links to the models and data.
Abstract: Over the last two decades, there has been a growth in the applications of geographically-explicit agent-based models. One thing such models have in common is the creation of synthetic populations to initialize the artificial worlds in which the agents inhabit. One challenge such models face is that it is often difficult to create reusable geographically-explicit synthetic populations with social networks. In this paper, we introduce a Python based method that generates a reusable geographically-explicit synthetic population dataset along with its social networks. In addition, we present a pipeline for using the population datasets for model initialization. With this pipeline, multiple spatial and temporal scales of geographically-explicit agent-based models are presented focusing on Western New York. Such models not only demonstrate the utility of our synthetic population on commuting patterns but also how social networks can impact the simulation of disease spread and vaccination uptake. By doing so, this pipeline could benefit any modeler wishing to reuse synthetic populations with realistic geographic locations and social networks. 
Keywords: Agent-Based Model, Geographically-Explicit Agent-Based Models, Synthetic Population, Python, Mesa.
Pipeline of Utilizing Synthetic Population Resulting Datasets in Agent-Based Models.

Large Scale Disease Spread Model Structure.

Disease Dynamics for Two Diseases.

Vaccination Opinion Dynamic Model.

Simulation Vaccination Rate v.s. Real Vaccination Records: (A) All Population; (B) Different Age Groups of Population.

Full Referece: 

Jiang, N., Crooks, A.T., Yin, F. and Wang B. (2023), Geographically-Explicit Synthetic Populations for Agent-based Models: A Gallery of Applications, Proceedings of the 2023 Conference of The Computational Social Science Society of the Americas, Santa Fe, NM. (pdf)

Monday, October 23, 2023

Evaluating the incentive for soil organic carbon sequestration from carinata production

Over the years we have developed several agent-based models that have explored various aspects of farming, ranging from farmers selling their land for development to that of water reuse. Keeping with this theme, we have a new paper with Kazi Ullah and Gbadebo Oladosu in the "Journal of Environmental Management" entitled "Evaluating the incentive for soil organic carbon sequestration from carinata production in the Southeast United States". 
 
In the paper we developed an agent-based model to evaluate what incentives might be needed for farmers to sequester soil organic carbon (SOC) when adopting a new bioenergy crop namely carinata. We simulated two carinata management scenarios: business as usual and climate-smart (no-till). The model finds that SOC sequestration incentives reduce the seed price needed to reach maximum adoption rates. While incentives lead to higher adoption rates, SOC sequestration, and profitability with no-till farming. 
 
If this sounds of interest, below you can read the abstract to the paper, get a sense of the agent logic and see some of the results. While at the bottom of the page, you can find the full reference and a link to the paper. The model (created in NetLogo) and data needed to run it is available on Kazi's GitHub page: https://github.com/KaziMaselUllah/Incentive_SOC_Carinata.

Abstract: Soil organic carbon (SOC) can be increased by cultivating bioenergy crops to produce low-carbon fuels, improving soil quality and agricultural productivity. This study evaluates the incentives for farmers to sequester SOC by adopting a bioenergy crop, carinata. Two agricultural management scenarios – business as usual (BaU) and a climate-smart (no-till) practice – were simulated using an agent-based modeling approach to account for farmers’ carinata adoption rates within their context of traditional crop rotations, the associated profitability, influences of neighboring farmers, as well as their individual attitudes. Using the state of Georgia, US, as a case study, the results show that farmers allocated 1056 × 103 acres (23.8%; 2.47 acres is equivalent to 1 ha) of farmlands by 2050 at a contract price of $6.5 per bushel of carinata seeds and with an incentive of $50 Mg−1 CO2e SOC sequestered under the BaU scenario. In contrast, at the same contract price and SOC incentive rate, farmers allocated 1152 × 103 acres (25.9%) of land under the no-till scenario, while the SOC sequestration was 483.83 × 10³ Mg CO2e, which is nearly four times the amount under the BaU scenario. Thus, this study demonstrated combinations of seed prices and SOC incentives that encourage farmers to adopt carinata with climate-smart practices to attain higher SOC sequestration benefits.

Keywords: Agent-based model, Bioenergy, Climate-smart agriculture, Soil organic carbon, Incentives, Sustainable aviation fuel.


Process, overview and scheduling of the model

An example simulation output of a model run (SOC incentive = $50 Mg−1 CO2e, Carinata contract price = 6.5, Expanded diffusion, Low initial willingness scenario).

The total number of farmers who adopted carinata over the years for two farming scenarios at five levels of incentives for SOC sequestration and at the four price levels.

The mean land allocation area for four scenarios and their associated standard deviations (error bar).
 

Full Reference:  

Ullah, K.M., Gbadebo G.A., and Crooks, A.T. (2023), Evaluating the Incentive for Soil Organic Carbon Sequestration from Carinata Production in the Southeast United States, Journal of Environmental Management, 348: 119418. Available at https://doi.org/10.1016/j.jenvman.2023.119418 (pdf)